Cost per Unit
Food Manufacturing’s main KPI during inflation: Cost per Unit. Why is it a better KPI than Profit Margin currently?
Cost per Unit
There are many metrics and KPIs involved in Food Manufacturing. Right now, we will argue that the most important KPI to monitor is the Cost per Unit produced. This will show the cost fluctuations in the markets, production costs and always highlight where the margin should be on the retail price.
There are many cost drivers within Food Manufacturing. Labour, equipment, ingredients, energy and logistics. But also commonly shared expenses – SG&A – like Administration, Marketing, Sales. Some are fixed, some are variable and adjust to the current market situation.
If all the costs are always held in comparison to the number of units produced and their retail price, you will become more enlightened and capable of handling market cost fluctuations proactively.
Let’s create a company here, just for the example – and it is a very rough example just to highlight the basics.
My Crow Management Food Inc.
If we look at the total there are not that many fluctuations. The cost level is stable, except for April where the company invested in new equipment with a payment upfront.
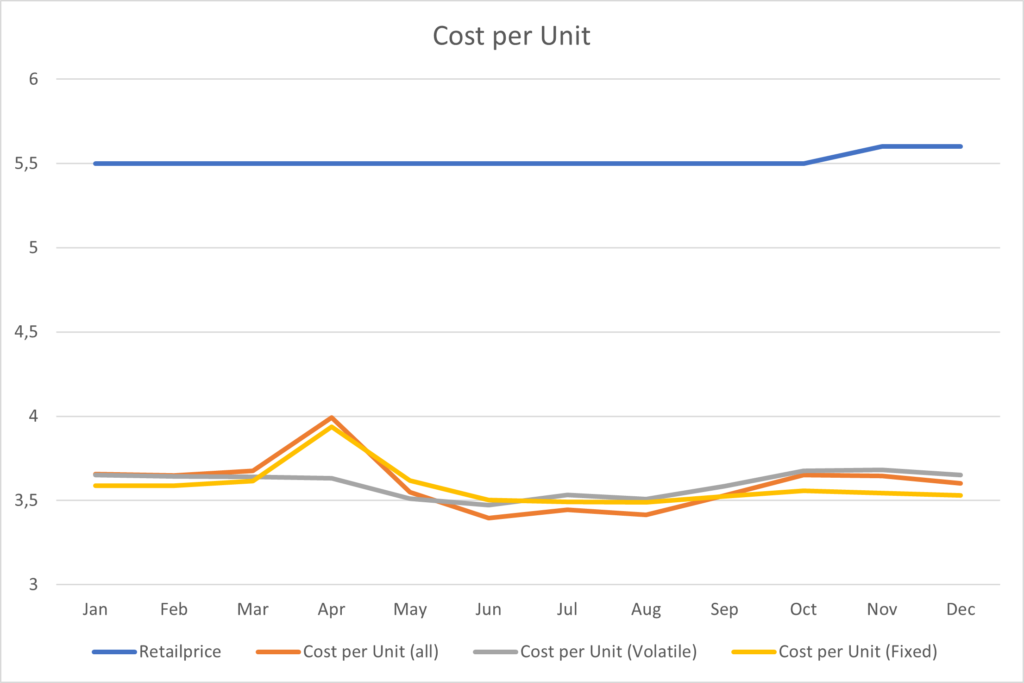
Let us look at the company’s output, revenue and Profit Margin.
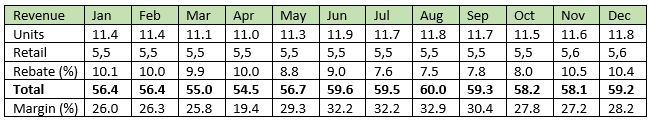
It’s easy to perceive such numbers in retrospective and see what happened. Much harder to project into the future. But let us conclude a few things from these numbers:
- March and April had a drop in revenue due to new equipment being prepared and installed in April. Basically, less units were produced due to downtime.
- In June there was an increase in revenue as more units were produced than normal – again due to new equipment. Redundant workers were also being laid off which shows as a decrease in salary costs from June forward.
- Revenue peaks in August with a Profit Margin on 32.9% with the second-highest output of the year and lowest amount of rebates given.
What Happened in October?
In October the Profit Margin dropped. Comparing October with August we can see a significant change in energy costs. But there is another thing, that may have gone unnoticed, as we have celebrated the Margin Increase since May. In June the Ingredient costs also increased. Some was due to the added output.
The added ingredient costs were a bit hidden comparing the numbers month over month, after the equipment change and lower numbers of units were outputted. June showed the upgrade as a major success on the Revenue reaching a Profit Margin well above 30%.
It shows how much influence a volatile market can have on a production. October had more costs than august, and we may suspect the problem is mainly due to an increase in Energy Costs, but it is a combination of more factors that played in earlier.
It is more justifiable to compare January and October against each other. The total costs are only 0.3 apart. The differences are clear: Energy is not the reason for the added costs. It is the ingredients, no doubt. So why didn’t this change show more clearly in the totals in June when the ingredient prices increased?
It did, but we were busy optimizing other things – mainly the increased output that also caused an increase in costs and lowering the Salary costs. The increase could have been a bleep on the radar, but it seems the ingredient pricing sticks at an appr. 5% increase. The company couldn’t know that at the time with everything that was going on.
To even the added costs the company decides to increase its retail price in November with 0.1. It reinstates the same rebates as the start of the year and added more SG&A costs for sales and controlling.
Overall, looking over the year nothing much happened. Costs were moved from one place to another. Output was increased but the margin only lifted a few percent. No equipment can solve volatile markets.
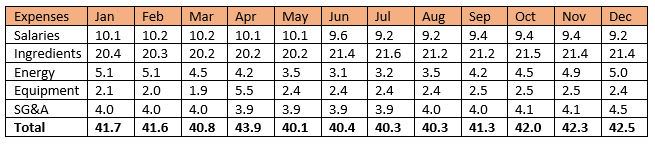
Cost per Unit – All, Volatile and Fixed
Monitoring the Cost per Unit in realtime could perhaps have been a decision support tool to highlight what action to take and when to take it.
Cost per Unit is easy to calculate. Just divide the total costs with the number of units produced. But that merely shows the volatility of the cost level, that can be used to set the Profit Margin. Identifying Min/Max periods and the fluctuation is a help though.
Grouping the costs gives a better indication. Ingredient costs and Energy costs are volatile market prices and something you are not in direct control of. We call this Volatile Cost per Unit. To level it with the overall Cost per Unit, we include the yearly average of the other costs.
Salaries, Equipment and SG&A is something you can control directly and change. We call this Fixed Cost per Unit – we know they aren’t fixed per se. And again, we include the yearly average of the volatile costs to keep it in level. This is the graph it produces:
You can clearly see the Volatile Cost per Unit (grey) is above the total Cost per Unit (red) already in June, well before we saw the Profit Margin drop in October. When both Volatile and Fixed Cost per Unit are higher than the total Cost per Unit, trouble is a brewing!
Everything looks well balanced beginning of year. The Volatile Cost Per Unit is well aligned with the overall Cost per Unit. When the equipment was getting upgraded the Fixed Cost per Unit peak.
It clearly shows in April that the margin would be very low as the gap of the cost price and retail price is low. We would of course know that in advance when the equipment order was made. The volatile cost went under the radar here.
In July you can see the grey curve is now the main driver of your expenses. This is a strong hint you should monitor and prepare a contingency plan. The volatile Cost per Unit was higher than the overall Cost per Unit! In August it had been for 3 months straight.
A price increase could have been introduced at that time. Instead price was increased in november but the increase was too small to withstand the increase in energy costs as well. The best scenario could have been raising the retail price to 5.6 in August and again to 5.7 in November to secure Profit Margin.
The Cost per Unit calculations can show many different scenarios including the impact of Downtime. Planned as well as Unplanned.
If you have Planned downtime, you are in control and know when the impact comes and can adjust accordingly. You know the decrease in output albeit the Fixed costs remain the same.
Unplanned downtime can be calculated the same way. The time period, the cost in that period and the output in that period. This can be aligned in the total Cost per Unit and give a strong indication early on, on what this means to the margin. It allows other departments to adjust, ex. adjust the discount levels, retail price and/or start negotiating new deals in the supply chain.
Everyone working for the company should know the Cost Per Unit and how they can affect it positively. But in a time of inflation volatility is the problem, and best to be prepared for it.
How about the Equipment?
My Crow Management Inc. bought and installed equipment in April. But was that a bad idea – numbers didnt change much?
Well, they did change. The automation cut 0.5-0.6 in costs and improved the output with 0.4-0.5 units. Imagine if they hadn’t done it! The Profit Margin wasn’t strong to begin with and without the automation the company could be in dire straits – Profit Margin in December would be 24,7% without automation.
So well done – Automation is a strong answer to lower costs and risk in Food Production.
Source:
https://www.foodboro.com/blog/unit-costing-food-businesses
https://justfooderp.com/whitepapers/costing-best-practices/